
Energy Module
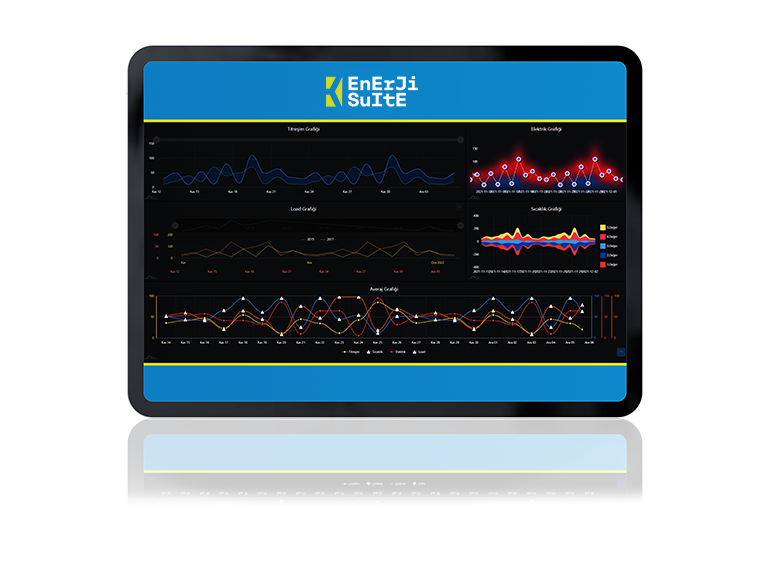
Our aim with the Energy Module is to provide instantaneous graphical and tabular analysis of the temperature, load, vibration and electrical values coming from the machine.
Thanks to the Energy Module (Energy Suite), instant graphs of “temperature”, “vibration”, “load” and “electricity” values are displayed in the form of an instant table, and when these values reach a certain level, notification is sent as a push notification. While push notification and all transactions are kept in the log, the privilege of manually adding-deleting-updating all table and graph values is also obtained. While all graphic values can be printed (Excel-PDF-A4), regular reporting is also performed with the "PowerBI Reporting system". Users have the opportunity to receive PowerBI reports daily.
All incoming values come every 6 seconds. These incoming values are provided to the user with a push notification when values that are well below or well above the machine reference values are reflected.

